Representation of any research data and case study are easily understand by chart and statistics, this solid data of research adds integrity to our blog post. In this post we have compiled a list of some of the creative free charts widgets for wordpress blogs. These charts let’s you divide the worth data into sectors and display the information such as poll data, Sports scores, comparison of something, etc.
All these Widgets are free, and you simply need to copy-paste the scripts onto your Blog or Website and you are good to go. No coding need to be done, and you can also customize the look and type of chart for most of these services. You might also want to take a look at our previous selections: Free WordPress Product Review Plugins, Premium Personal Blog WordPress Themes, Free Wedding Planner WordPress Themes and Free Scroller Widgets for WordPress.
1. WP Business Intelligence Lite
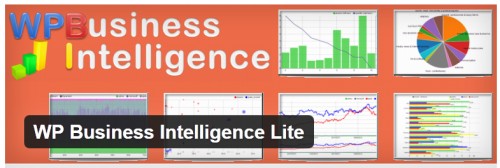
Adding charts and tables to your web site has never been that easy. WP Business Intelligence Lite transforms your WordPress platform in a reporting tool with responsive charts and tables. Charts are powered by D3, a powerful JavaScript library for manipulating documents based on data. Tables are powered by DataTables and provide sorting, filtering and dynamic paging by default.
2. Altos Toolbar
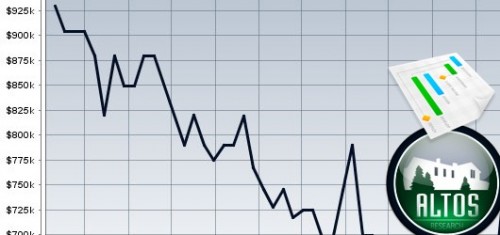
Easily insert Altos Charts, Regional Charts, Flash Charts and Stat Tables into your blog posts using the Visual Editor for WordPress.
3. WooCommerce Putler Connector
WooCommerce Putler Connector sends transactions to Putler using Putler’s Inbound API. All past orders are sent when you first configure this plugin. Future orders will be sent to Putler automatically. You need a Putler account (Free or Paid), and a WooCommerce based store to use this plugin.

4. WP App Studio
WP App Studio allows you to build fully featured sites without writing a single line of code in the form of WordPress plugins. Create single or multiple select custom taxonomies with full WordPress API support and more. Create help screens for your custom post type (entity) and custom taxonomy screens. Create Twitter Bootstrap or jQuery UI based responsive forms with advanced components.

5. Axis for WordPress
Axis is a plugin for creating fancy D3-based charts in WordPress, using axisJS, an Angular-based framework for streamlined chart creation. It is based off Quartz Chartbuilder and created by Times Digital Development. Please note that this is a work in progress and currently under active development.

6. amCharts – Charts and Maps
Ever tried getting JavaScript content into your WordPress posts or pages? Yeah, that’s impossible. WP strips down all the JavaScript. This makes adding JavaScript Charts and Maps a hassle. Developed and maintained by amCharts staff, this plugin solves the problem by allowing you to create chart code snippets, that then subsequently can be inserted into the posts or pages as a shortcode.

7. RJ Quickcharts
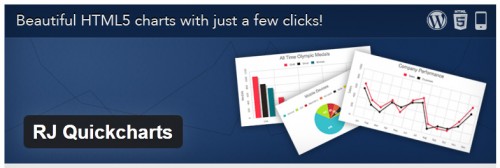
RJ Quick Charts is the only WordPress plugin available that allows users to easily enter data that is immediately built out into a chart below as they type. Quick Charts uses all native WordPress UI so it feels right at home without adding any excessive bloat to your site.
8. Display SQL Stats
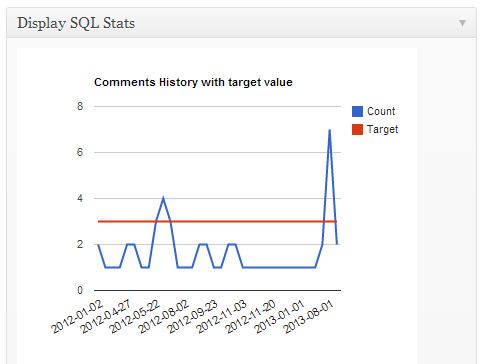
Displaying SQL result data as graphical chart on your blog (shortcodes) or your dashboard with use of Google Chart Tools.
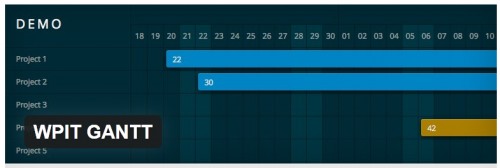
9. WPIT GANTT
You can create as many gantt as you like, then you insert a shortcode in post or page and the gantt we’ll be rendered. Based on the gantti class by Bastian Allgeier It has been tested only on WP 3.4 and up, maybe works with older versions too.
10. Google Trends & Charts
Gibt Google Trends Graphen per Shortcode aus, zudem kann es die Top-Suchanfragen bei Google in einem Widget oder per Shortcode ausgeben.
